
|
|
|
|
|
|
VDMS Tour: OUTPUT VDMS records over 200 dynamic variables during a simulation run. Click
here to view a sample output list from the VDMS User's Manual.
These variables are stored in the MATLAB workspace. The workspace also contains
an echo of the input variables. From the workspace these can be: The recording interval of the output is controlled by a "decimation" setting in
the input. Due to the fine integration step sizes required, it is often
unnecessary to record output every timestep. The decimation feature conserves
memory, increases the speed of the simulation and allows for faster
plotting/analysis. Of course, the user may develop their own graphs using MATLAB's extensivie
plotting capabilities. For convenience, the VDMS plotter contains 9 "hooks" for
the user to add User-Defined Plots to the GUI. Sample VDMS output plots are shown below (Click to Enlarge). These were produced
by the VDMS plotter using the GUI. All plots are from the same simulation run. .
VDMS TOUR
<< Previous | Next >>
|
|
|
Home | Services | Software | Books | News Briefs | About MRA | Contact Us | Site Map |
|
 
|
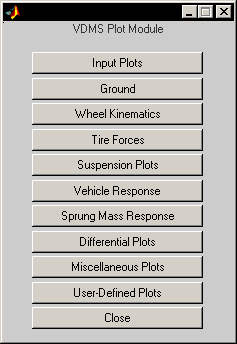 The VDMS Plotter contains over 50 preprogrammed plots. These plots are accessed
through a menu of buttons as shown at right. A list of available plots taken
from a VDMS User's Manual can be accessed by clicking
The VDMS Plotter contains over 50 preprogrammed plots. These plots are accessed
through a menu of buttons as shown at right. A list of available plots taken
from a VDMS User's Manual can be accessed by clicking